
An hourly rate sounds straightforward until you try to picture it spread across a full working year. Turning it into weekly, monthly and yearly figures shows what the job actually delivers before the tax authorities take their share.
A Standard Full-Time Year Turns an Hourly Rate Into an Annual Figure
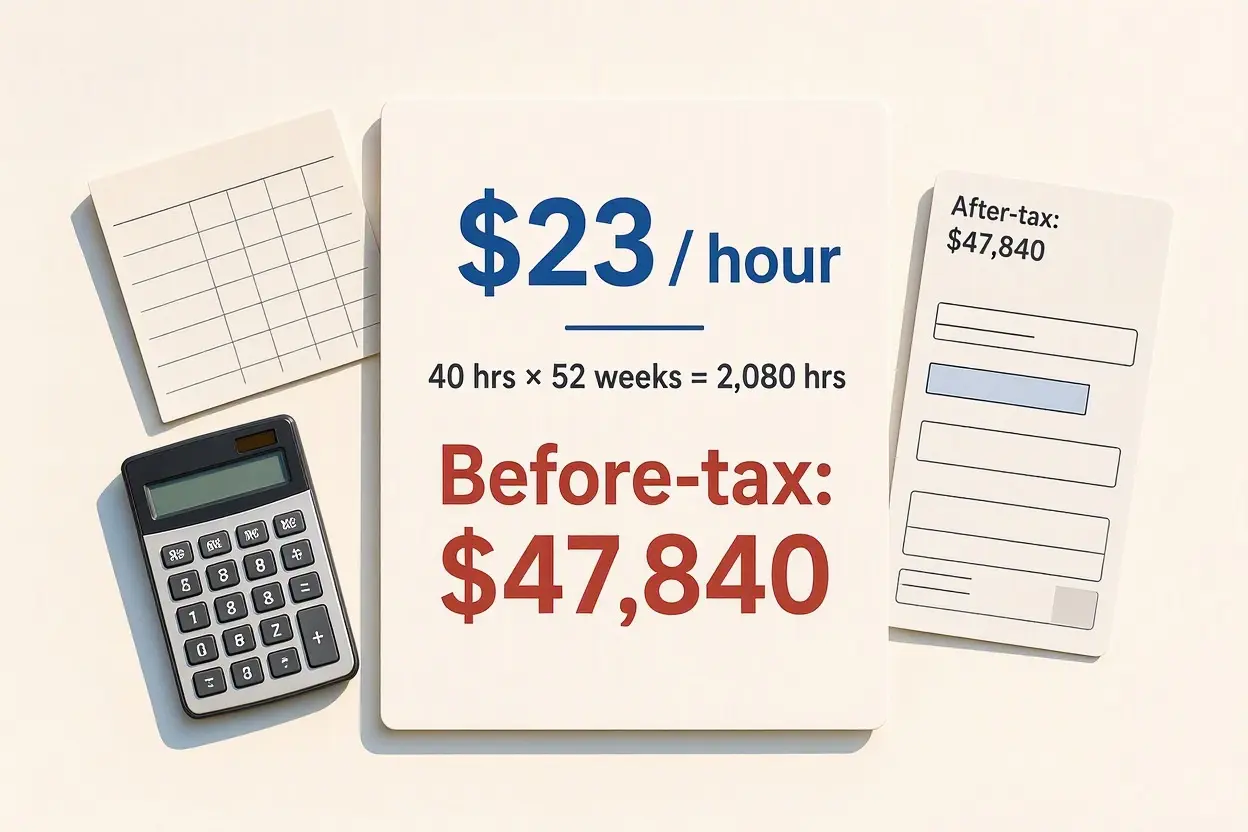
The conversion rests on one standard pattern, and every figure that follows in these opening sections uses it. Full time work is commonly reckoned in the United States as forty hours a week across fifty two weeks of the year. Multiply those two numbers together and the working year holds two thousand and eighty hours in total. Every annual figure built on a full time pattern starts from that total.
Apply the pattern to the wage in question. Twenty three an hour, multiplied by two thousand and eighty hours, gives forty seven thousand eight hundred and forty a year before any deductions. That is the headline gross figure, the number to compare against salaried posts and the number from which every smaller equivalent below is drawn. It describes a year with no unpaid time away, no overtime, and no gaps between jobs.
The formula generalises to any wage, which makes it worth holding onto. Take the hourly rate, multiply it by the hours worked each week, then multiply the result by the number of weeks worked in the year. There is also a quick mental shortcut for rough conversations. Double the hourly rate and treat the answer as thousands for an approximate yearly figure. Doubling twenty three gives forty six, suggesting roughly forty six thousand, close enough for a first impression, though the fuller calculation above gives the truer total because the standard year holds slightly more than two thousand hours. Anyone weighing how much freelance designers charge for their own work uses the same arithmetic in reverse, turning a needed yearly income back into the hourly figure that would deliver it.
Weekly, Fortnightly and Monthly Equivalents Make Budgeting Easier
Yearly totals are hard to budget with, because life is billed in smaller chunks. Breaking the same wage down makes it usable. A single week at forty hours brings nine hundred and twenty before deductions. A fortnight, covering two working weeks, brings one thousand eight hundred and forty. A single working day of eight hours brings one hundred and eighty four, a helpful figure for judging the worth of one extra shift or the cost of one unpaid day away.
Monthly figures need a small warning, because two different patterns share similar names. Paid twice a month, on a semi monthly pattern, each payment covers half a month and works out at about one thousand nine hundred and ninety three before deductions, with twenty four such payments across the year. Worked out as a straight monthly average, by dividing the yearly total into twelve equal parts, the figure is about three thousand nine hundred and eighty seven a month.
Confusing those patterns causes real budgeting errors. A worker paid fortnightly receives twenty six payments a year, which means two months quietly contain a third payment, while a worker paid semi monthly never sees that bonus month. Lay the equivalents side by side and the wage stops being an abstract rate and becomes a set of numbers you can actually plan a household around.
Unpaid Leave Shrinks the Headline Figure Quickly
The headline figure assumes every one of the fifty two weeks is worked or covered by paid leave. Paid leave changes nothing, because the hours are paid whether you stand at your post or sit on a beach. Unpaid leave is another matter entirely. Every unpaid week removes a full week of pay from the year, and the totals fall faster than many workers expect.
Suppose two weeks of the year go unpaid, for travel, family needs or a gap the employer will not cover. The working year then holds two thousand hours rather than two thousand and eighty, and the same hourly rate delivers forty six thousand a year before deductions. Stretch the unpaid absence further, to a working year of one thousand nine hundred and twenty hours, and the total drops to forty four thousand one hundred and sixty. Nothing about the wage itself changed. Only the count of paid hours moved, yet the yearly difference runs into the thousands.
Part time patterns show the same principle from the other side. At twenty hours a week across a full year, the same rate gives twenty three thousand nine hundred and twenty. At twenty five hours a week it gives twenty nine thousand nine hundred. At thirty hours a week it gives thirty five thousand eight hundred and eighty, and at thirty seven and a half hours a week it gives forty four thousand eight hundred and fifty. Employers sometimes quote an hourly rate beside a full time yearly figure even for part time posts, so always ask which hours the yearly figure assumes before you judge an offer.
Extra Hours Beyond the Standard Week Lift Earnings Sharply
Overtime rewrites the picture, because hours beyond the standard week are commonly rewarded at a higher rate. The usual pattern, explained in the overview of overtime and how extra hours are rewarded, is time and a half, meaning half as much again on top of the ordinary rate. On a wage of twenty three an hour, time and a half works out at thirty four and a half an hour for each extra hour worked.
Small weekly amounts compound impressively across a year. Five overtime hours every week, paid at that higher rate, lift the yearly total to about fifty six thousand eight hundred and ten before deductions. Ten overtime hours every week lift it further, to about sixty five thousand seven hundred and eighty. A double time pattern, used by some employers for Sundays or holidays, pays twice the ordinary rate, which on this wage means forty six an hour for those hours.
Two cautions belong beside those attractive totals. First, overtime is rarely guaranteed. It follows the needs of the employer, it can vanish in a quiet season, and building fixed household spending on unguaranteed hours is risky. Second, overtime is still taxed, and it still costs time and energy that have their own value. The legal framework behind these patterns comes from the landmark workplace law described in the history of the American law governing wages and hours, which established the standard working week and the principle of higher pay beyond it for covered workers in the United States.
Deductions Decide What Actually Reaches Your Bank Account
Gross pay is the figure on the offer letter. Net pay is the figure that pays the rent, and the gap between them is wide. In the United States, a worker on this wage can expect federal income tax to take a share first, with the exact amount depending on earnings, filing status and the standard deduction. Alongside it sit the payroll deductions for social security and Medicare, together known as FICA, which take seven point six five out of every hundred of pay. On this salary that slice alone comes to about three thousand six hundred and sixty a year.
State tax adds a further layer that varies enormously by address. Some states levy no income tax at all, while others take a few thousand across the year from a wage at this level. Local rules, pension contributions and health cover premiums can trim the payment further still, none of which appear in the headline rate.
Putting the layers together, a cautious estimate places the take home amount for a single filer using the standard deduction somewhere between about thirty eight thousand and about forty one thousand a year. Treat that range as an estimate and nothing more. Individual circumstances shift it in both directions, through filing status, dependants, extra deductions and the state in question. Any calculator or adviser promising an exact figure for every worker on this wage is claiming a precision that the American tax system simply does not allow.
Nearby Hourly Rates Show How Small Rises Add Up
A single extra unit an hour sounds trivial in a negotiation. Spread across a full time year, it is anything but. Each rise of one on the hourly rate adds two thousand and eighty to the yearly gross figure. Two neighbouring rates make the point clearly.
At twenty two an hour, one step below the wage in question, the full time year delivers forty five thousand seven hundred and sixty before deductions. At twenty four an hour, one step above, it delivers forty nine thousand nine hundred and twenty. At twenty five an hour it delivers fifty two thousand. The gap between the lowest and highest of those three rates is three an hour on paper, yet more than six thousand a year in practice.
That arithmetic is worth remembering in a pay review. A modest sounding rise, won once, pays out again in every week that follows, lifts every overtime hour paid at time and a half, and often raises the base on which future rises are calculated. Arguing for one extra unit an hour is arguing for a sum that repeats more than two thousand times a year. Few other single sentences spoken at work carry that kind of weight.
The Same Wage Stretches Further in Some Places Than Others
Whether this wage counts as good pay depends heavily on the ground beneath it. Set against broad national reference points, it sits above the federal minimum wage in the United States, which stands at seven point two five an hour, so this rate pays more than three times the national floor. Set against a broad national median annual wage of about fifty nine thousand, the full time total of forty seven thousand eight hundred and forty sits below the middle, though such comparisons are approximate and shift with time, so treat them as context rather than verdict.
Place matters as much as the national picture. In a town with modest rents and short journeys, this wage can cover a household comfortably, leave room for saving, and absorb the odd emergency without panic. In a large coastal city with steep housing costs, the same wage demands careful budgeting, shared housing or long journeys to work, and leaves little slack when a car fails or a boiler breaks. Two workers on identical pay can honestly describe very different lives.
The fairest judgement therefore combines the three lenses used throughout. Start with the converted figures, weekly, monthly and yearly. Then subtract a realistic estimate of deductions for your own filing position and your own state. Finally, weigh what remains against the housing and living costs where you actually live, or where a job offer would require you to live. A wage is never good or bad in the abstract. It is good or bad for a household, in a place, against a set of bills, and the arithmetic above gives you everything needed to judge it on those honest terms.