
Climate change is the most evidence-backed finding in modern science — and the most contested in public debate. That paradox confuses people: if the evidence is so strong, why does it feel uncertain? The answer is that the evidence and the debate operate in different arenas. This guide walks through the actual evidence for climate change — what scientists measure, how they know, and how confident they are — in plain language, without preaching or politics. Whether you are convinced, sceptical, or somewhere between, the evidence deserves a fair hearing on its own terms.
You will learn the five independent lines of evidence, how scientists attribute warming to human activity, what the measurements show for the UK specifically, how uncertainty is honestly handled, and where to read the primary sources.
Line 1: the thermometer record
Direct temperature measurements — from weather stations, ships, buoys, and satellites — show the planet has warmed by approximately 1.2°C since the late 19th century, with the warming accelerating: the last decade was the warmest on record, and each of the last several years has ranked among the hottest ever measured. This is not one dataset but many independent ones (NASA, NOAA, the UK Met Office’s HadCRUT, Berkeley Earth, satellite records) that agree closely despite different methods and institutions — including analyses funded by sceptics that confirmed the warming. The urban heat island effect (cities being warmer) is real but accounted for: rural-only station analyses show the same trend. The warming is also not uniform in ways that confirm the mechanism — nights warming faster than days, winters faster than summers, the Arctic fastest of all — exactly the fingerprint of greenhouse warming rather than, say, increased solar output. The Met Office climate data publishes the UK-specific records openly.
Line 2: the CO2 record and the physics
Atmospheric CO2 has risen from ~280 parts per million (pre-industrial) to over 420 ppm today — measured directly since 1958 at Mauna Loa and confirmed by ice-core records stretching back 800,000 years. The isotopic signature of the added CO2 matches fossil fuels specifically (depleted carbon-13 — plants preferentially absorb carbon-12, so fossil carbon from ancient plants carries that signature). We know how much fossil fuel humanity burns; the atmospheric increase matches roughly half of it (the oceans and biosphere absorb the rest). And the greenhouse physics is 19th-century science: John Tyndall measured CO2’s heat-trapping properties in 1859, and the basic calculation — more CO2, more trapped heat — has been confirmed by satellite measurements showing less heat escaping to space at exactly the CO2 absorption wavelengths. This is not modelling; it is direct observation of the mechanism operating.
Line 3: the fingerprints
Scientists test causation through “fingerprints” — patterns that distinguish greenhouse warming from other causes. Increased solar output would warm all atmospheric layers; instead the upper atmosphere (stratosphere) is cooling while the surface warms — the precise signature of heat being trapped below. Nights warming faster than days, winters faster than summers, and the tropopause rising all match greenhouse predictions and contradict solar or natural-cycle explanations. Natural factors (solar cycles, volcanic activity, orbital changes) have been quantified and are currently net-neutral or slightly cooling — they cannot explain the observed warming, and when included in models, the models only reproduce reality when human greenhouse gases are added. This attribution work is why the IPCC states it is “unequivocal” that human influence has warmed the planet.
Line 4: the corroborating witnesses
Independent physical systems all tell the same story: Arctic sea ice declining ~13% per decade, glaciers retreating on every continent, ice sheets in Greenland and Antarctica losing mass (measured by gravity satellites), sea levels rising ~3.7mm per year and accelerating, oceans absorbing ~90% of the excess heat (measured by thousands of autonomous Argo floats), ocean acidification increasing as CO2 dissolves, species migrating poleward and upward, and growing seasons lengthening. Any single indicator could have an alternative explanation; all of them shifting together in the direction greenhouse physics predicts is consilience — the strongest form of scientific evidence, where independent lines converge on one conclusion.
Line 5: the UK picture
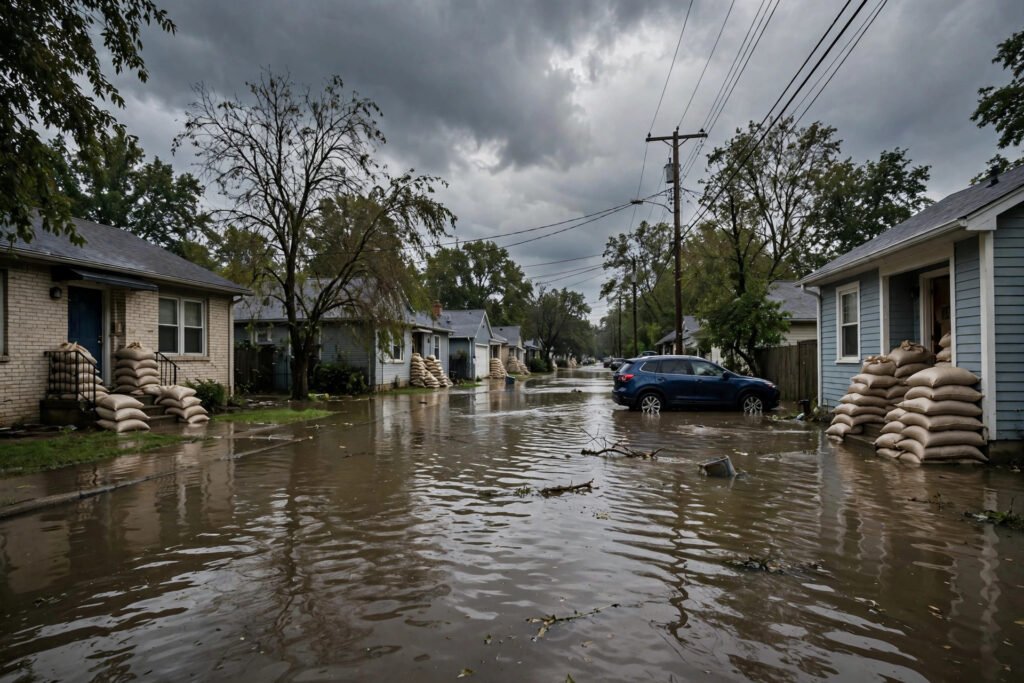
The UK’s own records confirm the global story locally: the UK has warmed by about 1.2°C since pre-industrial times, the ten warmest years on record have all occurred since 2002, sea levels around the UK are rising, and the Met Office documents increases in heavy rainfall events and heatwaves. UK impacts already observed include more frequent flooding, hotter summers stressing infrastructure and health, and shifts in growing seasons. None of this requires trusting foreign institutions — it is measured by British instruments, published openly, and consistent with the global datasets. For daily life, dressing for Britain’s increasingly unpredictable weather is the small-scale adaptation everyone is already practising, and building a wardrobe for UK weather reflects the same shifting patterns.
How uncertainty honestly works
Real scientific uncertainty exists — but about how much and how fast, not whether. Climate sensitivity (how much warming per CO2 doubling) is estimated at 2.5–4°C; the exact pace of ice-sheet collapse is uncertain; regional rainfall projections carry wide error bars. Scientists state these uncertainties openly — they are in every IPCC report, quantified and discussed. What is not uncertain: that the planet is warming, that CO2 is rising due to fossil fuels, that the greenhouse mechanism is operating as physics predicts, and that human activity is the dominant cause. The “debate” you see in media often confuses uncertainty about details with uncertainty about the fundamentals — they are different things, and only the former is scientifically live. The IPCC reports themselves are the primary source, written in surprisingly accessible summaries for policymakers.
Conclusion
The evidence for climate change rests on five converging lines: the thermometer record (1.2°C of warming, independently confirmed), the CO2 record (420+ ppm with a fossil-fuel isotopic fingerprint, trapping heat at exactly the predicted wavelengths), the fingerprints (stratospheric cooling, night/winter amplification — greenhouse signatures, not solar), the corroborating witnesses (ice, seas, oceans, ecosystems all shifting together), and the UK’s own records confirming it locally. Uncertainty exists about pace and detail, not about the fundamentals. You do not need to trust any single institution — the evidence is open, multi-sourced, and convergent. Read it, weigh it, and decide on the evidence’s terms.
Frequently Asked Questions
How do scientists know climate change is caused by humans?
Through attribution fingerprints: the isotopic signature of added CO2 matches fossil fuels, the stratosphere is cooling while the surface warms (the greenhouse signature, opposite to solar warming), and climate models only reproduce observed warming when human emissions are included. Natural factors are currently net-neutral or cooling.
Has the climate not always changed naturally?
Yes — but past changes have known natural causes (orbital cycles, solar variations, volcanism) operating over thousands of years. Current warming is an order of magnitude faster, coincides precisely with the fossil-fuel CO2 increase, and carries the greenhouse fingerprint rather than any natural cause’s signature.
How much has the UK warmed?
About 1.2°C since pre-industrial times, with the ten warmest years on record all since 2002. The Met Office also documents rising sea levels around the UK and increases in heavy rainfall events and heatwaves.
What is the difference between weather and climate?
Weather is short-term atmospheric conditions (days to weeks); climate is the long-term pattern (decades). A cold snap does not disprove warming any more than a hot day proves it — the evidence is in the decades-long trends across multiple independent indicators.